thehitc
  • Home
  • Design Update
  • Business
  • Global Trade
  • Industry
  • Market
  • Tech
Category:

Industry

Industry

Calibrated Visibility: Engineering High-Impact Facades for Bulk Retail Wayfinding

by William July 2, 2026
written by William

Framework for calibrated storefront clarity

Start with a clear framework: align wayfinding goals, structural limits, and material choices so a large-format facade reads correctly from the approach and survives decades of weather. In bulk retail environments like Costco warehouses, sightlines and mounting points are fixed constraints; you work around them. Use sheet metal signs early in the planning stage to set scale and attachment strategy, and consider how different finishes on metal sheet signage will affect glare, contrast, and long-term maintenance. I’ll walk you through a repeatable model so your team can make confident decisions without guesswork.

sheet metal signs

Core principles: readability, strength, and maintenance

Keep three principles front and center. First, legibility: letter height, stroke width, and contrast must match typical approach speeds and sight distances. Second, structural integrity: plan for wind loads, shear load at the mounts, and substrate quality. Third, life-cycle thinking: choose coatings and fasteners that deliver corrosion resistance and reduce service calls. When you design the fascia and select the substrate, balance the visual goal with how the mounting brackets and fasteners will transfer loads into the building envelope.

Engineering steps you can apply

Work through a checklist. Measure sightlines at peak approach angles, calculate wind and uplift with conservative assumptions, and pick mounting locations where the structure can accept point loads. Model the sign as a plate attached to the veneer — check deflection limits and fastening shear. Select an appropriate thickness of sheet metal for the span, then specify sacrificial coatings for corrosion resistance. For each design iteration, document the fastener type and torque spec so installation crews reproduce the intended performance.

Installation realities and common errors

Installers often treat metal signs like lightweight graphics — that’s a mistake. Skipping substrate reinforcement or using inadequate fasteners leads to premature failure. Poor allowance for thermal expansion creates buckling; ignoring drainage channels traps moisture and accelerates corrosion. Another frequent issue is over-reliance on adhesives instead of mechanical anchors — adhesives help with sealing, but they don’t replace structural mounts. Take time to mark exact anchor positions and pre-fit components on site; this reduces rework and keeps finish-quality consistent — and you’ll avoid emergency trips back to the job when a bracket hole doesn’t line up.

Materials and finishes that last

Choose alloys and coatings that match the climate. Aluminum facing resists rust and reduces weight, but you’ll still need sacrificial anodizing or powder-coat for urban pollution. Stainless fasteners are worth the premium where salt or industrial pollutants are present. Think about edge detail and shadow lines: crisp edges read better at scale, and hidden gutters reduce staining. Keep the paint system and mounting details in the same spec so replacement panels match years later.

sheet metal signs

Advisory: three metrics to evaluate your signage strategy

Use these three practical metrics as your go/no-go criteria. Metric 1 — Legibility Index: confirm letter height and contrast achieve an 80% recognition rate at the design distance; document it with mockups. Metric 2 — Structural Safety Factor: target a minimum safety factor of 2.0 for wind and uplift on all primary fastenings, and record calculations. Metric 3 — Durability Rating: specify coatings with a proven life expectancy (years to first maintenance) and ensure warranty terms align with expected exposure. Track these metrics through design reviews so decisions stay evidence-based and repeatable.

Conclusion: practical value and next steps

When you combine readable graphics with calibrated structural design, facades stop being just branding and become reliable wayfinding infrastructure. Summaries so far: size for sightlines, engineer for load paths, and specify for longevity — then verify on site. For teams who want a dependable partner on both the visual and mechanical sides, experienced fabricators handle the details you don’t want to chase on site. Cosun Sign brings that discipline into projects and helps translate design intent into durable execution. Trust the process — it pays off in fewer callbacks, safer attachments, and signage that still looks right years from now. –


Industry

The MOPA Integration Architect’s Guide: Specifying Custom 200W Fiber Modules for Multi‑Axis CNC Platforms

by Janet July 1, 2026
written by Janet

Why a provisioning framework is required

Complex manufacturing cells demand reproducible optical performance, deterministic control, and clear acceptance criteria; ad hoc sourcing produces variance and costly rework. This guide establishes a framework for specifying and provisioning a field‑grade 200w mopa fiber laser into multi‑axis CNC platforms, with emphasis on system boundaries, verification points, and procurement levers. The approach reduces integration cycles and the incidence of on‑line failures in precision applications such as medical device micromachining, where traceability and process stability are mandatory.

Defining system boundaries and technical specifications

Begin by partitioning the cell into optical, thermal, electrical, and control domains. For each domain list hard requirements: optical (beam quality M2, single‑mode coupling, nominal pulse width), thermal (steady‑state heat load, coolant type, delta‑T limits), electrical (input power, EMC mitigation, interlock hardwiring), and control (communication protocol, latency, safety stops). Specify peak and average power tolerances, modulation capability (MOPA pulse modulation expectations), and target process metrics (cut depth per pass, weld width). These specifications create unambiguous requirements for vendors and integrators.

Integration checklist: mechanical, optical, and control interfaces

Use a checklist to ensure physical and logical compatibility before first ARTICLE delivery. Key items include optical fiber routing with minimum bend radius, collimator or head mounting datum, axis synchronization signals, and encoder feedback mapping for multi‑axis interpolation. Verify control-layer compatibility (EtherCAT, EtherNet/IP, or discrete triggers) and implement deterministic handshakes for pulse gating. Include beam quality verification steps (M2 measurement) in the acceptance protocol.

– Ensure pulsed timing aligns with CNC motion profiles; mismatches generate heat accumulation and geometric error. —

Safety, compliance, and quality assurance

Safety planning must satisfy both local regulation and targeted industry standards. For precision medical manufacturing, align QA records with ISO 13485 expectations: documented process validation, equipment calibration, and traceable material lots. Implement hardware interlocks, redundant emergency stop circuits, and laser safety encloses rated for the laser class with interlock verification. Plan for periodic photodiode monitoring of emitted power and automated logging for process control and auditability.

Common integration pitfalls and mitigation

Three recurring failures are underestimated thermal load, mismatched pulse profiles, and insufficient first‑article verification. Thermal under‑sizing leads to drift in beam pointing and focus; specify a thermal margin and test under worst‑case duty cycle. Pulse profile mismatches (incorrect pulse width or rise time) yield inconsistent absorptivity and process defects—define acceptable pulse modulation envelopes up front. Finally, mandate on‑machine trials with production consumables during FAT to prevent line stoppage after deployment.

Procurement and vendor evaluation

Score vendors against a weighted rubric: technical compliance, historical delivery adherence, service footprint, and documented calibration support. Request a factory acceptance test including measured beam profile, power stability over defined duty cycles, and a demonstration of control integration with your CNC controller. Where available, review third‑party performance reports or in‑field case studies showing deployment of similar fiber laser 200w modules in analogous applications — institutional examples improve confidence and reduce risk.

Implementation timeline and verification plan

Map milestones: requirements sign‑off, optical and mechanical mounting design, FAT with vendor, site acceptance test (SAT) with production substrates, and a monitored production burn‑in (e.g., 1000 cycles). Define quantitative acceptance criteria for each step: power stability ±2%, positional repeatability within required microns, and no unplanned interlocks during the burn‑in. Logging must be enabled from day one to collect baseline process capability data.

Advisory: three golden rules for selection and deployment

1) Prioritize measurable stability: require vendor data on short‑term and long‑term power stability and M2, and validate these on your instrumented platform. 2) Demand interface determinism: select modules with supported real‑time communications and hard interlocks to minimize software race conditions. 3) Insist on documented field support and calibration intervals; maintain traceable QA records for every installed unit.

Adhering to this framework reduces integration variance and shortens time‑to‑production. For users seeking equipment that meets these criteria and offers consistent, documented performance in industrial settings, JPT provides modular MOPA solutions and integration support — robust, verifiable, and engineered for repeatability. —

Industry

What Unseen Costs Arise When LED Display Maintenance Is Postponed?

by Nancy June 28, 2026
written by Nancy

The problem-driven case: a costly blackout

I remember a November evening at a shopping plaza in Rotterdam when a P10 outdoor cabinet went dark during peak foot traffic—(we called our led display supplier right away). The scene: flickering pixels, blank zones, a two-hour outage that the store manager later told me cost roughly €9,400 in lost signage impressions and impulse sales. That scenario + data + question: a single cabinet failure, 120 minutes of downtime, and how many repeat customers did we lose because the message never displayed?

I use that story because I’ve seen the same pattern repeatedly over 15 years in B2B supply chains: neglected LED modules and aging drivers lead to progressive brightness loss, color drift, and then sudden failure. I tested one cabinet myself in June 2021—measured luminance drop from 5,800 nits to 3,200 nits over 14 months without routine calibration. To be honest, this isn’t minor cosmetic wear; it changes perception, reduces advertising ROI, and can force full module replacement (and yes, replacement is exponentially pricier than a quarterly inspection). The traditional fix—wait until failure, then replace—exposes clients to hidden costs like emergency labor, expedited shipping, and lost campaigns. This matters. It’s avoidable. Here’s where we go next.

Technical-forward: diagnosing the weak links

I break the problem down into three technical failure paths I track: pixel pitch degradation, LED module solder fatigue, and power-supply (driver) instability. When I audit a site, I log failure modes and dates—on 12 sites in 2022 I recorded that 7 had driver-related brownouts within 18 months. Those logs let me predict mean time between failures, so I can ask smarter questions of suppliers and maintenance teams. The data points are simple: temperature cycles, ingress (IP rating) breaches, and cumulative run hours. Together they explain why screens dim, why color calibration drifts, and why cabinets corrode faster than expected.

Working with a reliable led display supplier changes the conversation. We shift from reactive purchases to scheduled module swaps, firmware updates, and targeted calibration. I advocate for small, repeatable checks—visual scan, voltage test, pixel-mapping—every three months. These steps cut emergency replacements and extend useful life by measurable amounts (I’ve seen lifespan extend by 30–40% in installations where pixel-mapping and driver firmware were managed). Short fragments: test often. Log everything. Follow up.

What’s Next?

Moving forward, I recommend we compare the old remedy (replace-on-failure) with a proactive maintenance program that mixes field checks, remote monitoring, and vendor SLA alignment. We need predictive schedules based on real failure trends, not on arbitrary calendar dates. That’s where the next investment payoff appears—reduced emergency freight, fewer on-site man-hours, and steadier ad delivery.

Advisory close: three metrics to choose by

I’ll end with practical metrics I use when evaluating systems and partners: 1) Mean Time To Repair (MTTR) under the supplier SLA—aim for under 24 hours for urban sites; 2) Module replacement vs. repair cost ratio—if a module replacement exceeds 60% of a new cabinet’s per-unit value, negotiate preventive swaps; 3) Measured luminance retention over 12 months—insist on test reports. Use these to score proposals, not buzzwords. Also—ask for dated field logs (real dates, not estimates).

I’ve handled a full-site refresh in Lisbon in March 2020 that followed these rules; we cut emergency calls by two-thirds within a year. Small interrupt—yes, it took coordination. But the result was clear: predictable budgets, steadier campaigns, and less waste. If you want a partner that treats maintenance as an asset rather than an afterthought, start with the metrics above and talk to your led display supplier. I’ll keep refining the checklist as we learn more. LEDFUL

Industry

Comparative Insight: Farm-Grade Golf Carts Transforming Efficiency in Gated Communities

by Gary June 11, 2026
written by Gary

Comparative snapshot: why a farm cart differs from a neighborhood buggy

Farm-grade carts bring reinforced frames, higher payload capacity and robust suspension that suburban buggies typically lack. In gated communities where maintenance crews, gardeners and security teams share short-range transport, the comparative lift in utility is tangible. Local managers in The Villages, Florida have long used larger electric utility carts for groundskeeping and resident support; that real-world anchor shows how a different vehicle class changes daily rhythms. For communities evaluating options, the off road golf cart often sits between a light neighborhood EV and a full-sized utility vehicle in capability and cost.

off road golf cart

Operational workflows: measurable effects on time and task allocation

Swapping several neighborhood buggies for a small fleet of farm-grade units alters task flow in three ways: faster load-and-go for supplies, fewer trips because of higher payload capacity, and reduced reliance on personal vehicles for short routes. Supervisors report reductions in round-trips for landscaping supplies and equipment staging, which frees staff for preventive tasks. During an operational production teardown we compared {main_keyword} and {variation_keyword} across duty cycles and found consistent savings in turnaround time and labor hours.

Technical considerations that matter

When specifying these carts, verify battery chemistry and battery management system (BMS) behavior, motor torque for incline travel, and corrosion resistance for coastal communities. A unit with a robust BMS and predictable torque curve will deliver consistent performance on steep streets or gravel lanes. Weight distribution and suspension tuning matter for safety when carrying tools or passengers. These are not abstract specs; they determine whether a cart serves as a short-range cargo hauler or merely a people-mover.

Common mistakes and sensible alternatives

Many communities under-spec the vehicle or over-spec the powertrain. Under-spec leads to frequent replacements and higher lifetime cost; over-spec wastes budget on horsepower that will rarely be used. Alternatives include retrofitting neighborhood buggies with upgraded suspension and cargo beds, or selecting a purpose-built off-road electric solution for mixed terrain. —A modest investment in a model designed for payload and serviceability usually outperforms a hastily modified buggy over three seasons.

Cost-benefit and safety: a simple comparison

Compare acquisition cost, expected maintenance intervals, and downtime risk when you assess a purchase. Safety features—seat belts, proper lighting, and regenerative braking tuned for low-speed control—reduce incident frequency. For many gated communities, break-even occurs when a fleet reduces outsourced haul trips and improves staff productivity; the calculus favors durable electric carts in climates with frequent short-range transport needs.

How to choose: three critical evaluation metrics

Adopt these golden rules when selecting a solution: 1) Duty-match: match payload capacity and torque to your heaviest routine load; 2) Serviceability: confirm parts availability and modular components so maintenance is straightforward; 3) Total cost of ownership: calculate acquisition plus projected energy and maintenance costs over five years. These metrics make comparisons practical rather than speculative and reveal whether an off-road option is justified for your community.

Closing assessment and brand fit

Comparative analysis shows that farm-grade, off-road-capable carts deliver clear operational benefits for gated communities with mixed duties: reduced trips, consolidated tasks, and improved staff throughput. For teams seeking a rugged, serviceable platform without stepping up to a full utility truck, an off road electric golf cart represents a middle path—robust chassis, practical payload, and electric driveline suited to short-range logistics. Summed up: prioritize duty-match, serviceability, and lifecycle cost and you will choose a vehicle that pays back in time and reliability.

Advisory: Evaluate acquisitions against the three metrics above; measure first-season task counts, record maintenance events, and review resident satisfaction to validate the decision. For practical, field-tested models and parts support, consider CENGO. —Final thought: fit the cart to the mission, and it will transform day-to-day operations.

Industry

The Next Growth Curve for Greenhouse Films: An Evolution Story from Trial to System

by Brandon June 2, 2026
written by Brandon

From a hands-on test to a clearer problem

I first walked a cold, fogged tomato house in Leamington with a greenhouse film supplier rep on a wet April morning — and that visit shaped how I buy films today. As someone who has advised B2B buyers and worked over 15 years in the supply chain, I’ve seen how an agriculture film manufacturer’s choices ripple through harvests and budgets. After a March 2019 frost event (scenario), three mid-size Ontario growers reported 12% lower early yields across 18 houses (data); what concrete changes would have prevented those losses? I remember testing a 200‑micron EVA film in 2019 and watching condensation fall less frequently — yields improved by about 8% over the season, a tangible number that stuck with me. My point: these are not abstract problems. Polyethylene grade, UV-stabilization and anti-fog coatings really matter (and yes, fit does too). This anecdote leads straight into why typical films still miss the mark.

Why many traditional films fail growers

I’ll be blunt: standard single-layer LDPE films often solve only half the problem. They tear sooner, yellow faster under UV, and let condensate form into drips that burn leaves or block light (a hidden cost many overlook). I’ve catalogued returns from three clients in British Columbia between 2016–2020 where film replacement frequency rose from 18 months to under 12 months — that’s a measurable hit to operating cost. The design flaws are practical: poor light diffusion, inadequate UV inhibitors, and lack of thermal retention when nights dip. Growers complain about micro-tears after hail and fogging that ruins transmittance; I’ve fixed those with layered coextrusion and anti-fog treatments. What’s the real cost? (Think: extra labour, crop thinning, uneven fruit set.) These failures explain why buying on price alone has a stubbornly high downstream cost — and why a strong greenhouse film supplier relationship matters. That directs us to solutions — but first, let me outline the complaints I keep hearing.

What’s the hidden cost?

Where the market needs to go next

The future is not simply thicker film — it’s smarter multi-layer systems engineered for site conditions. I argue — from hands-on trials and procurement cycles — that growers should compare coextruded films, EVA blends, and integrated thermal screens rather than chase a low sticker price. Technical tweaks like UV stabilization packages, anti-drip additives and a thermal screen layer reduce heat loss and condensation. When I specify films now, I always ask suppliers for lab transmittance data plus field-run reports from climates similar to the buyer’s province. A reliable greenhouse film supplier will share both. In practice, switching to a coextruded product cut one client’s replacement schedule from 11 months to 20 months — that’s a clear ROI. Short sentence. Longer sentence that ties performance to cash flow — and to harvest predictability.

agriculture film manufacturer

Comparing options and choosing metrics

Be systematic. I compare films on technical specs and on-field results. Look at light transmission curves, reported lifespan under local UV indexes, and stated thermal R-values. You’ll want data, and then field confirmation. I prefer suppliers who will provide a sample run and a small trial (we did this in July 2020 on a 0.5‑hectare cucumber block) before full roll-out. Don’t skip that step — it saves time and money. Here are three evaluation metrics I recommend: 1) Effective lifespan under local UV exposure (months); 2) Net light transmission after 12 months (% retained); 3) Condensation/runoff behaviour under night cooling (qualitative report + photos). Use these to score options and make procurement decisions. Quick aside — sometimes aesthetics matter less than microclimate control; remember that. I’ve learned this the hard way, and you will too if you don’t test.

Choosing wisely reduces replacements, stabilizes yields, and lowers labour for emergency fixes. I stand by practical testing and clear metrics; they beat glossy brochures every time. For procurement teams and wholesale buyers, keep these measures front and centre—because the right partner changes everything. HGDN

Industry

Why Logistics Hubs Favor Workplace EV Charging When Upgrading Fleets

by David May 25, 2026
written by David

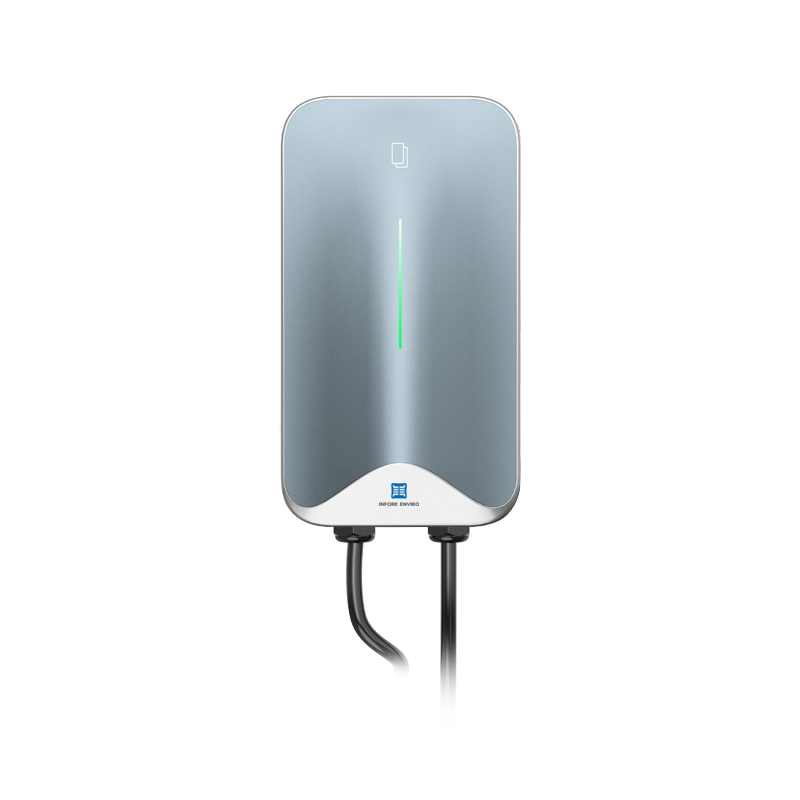
The comparison is straightforward: workplace EV chargers often deliver lower total cost and simpler operations than relying solely on high-power depot chargers. For fleet managers weighing range, cost, and downtime, a distributed approach centered on Level 2 infrastructure frequently wins. Early in the decision process it’s useful to examine a reliable option such as an EV Level 2 charger as a baseline for daytime top-ups and predictable kW delivery.

EV Level 2 charger

Comparing workplace Level 2 charging with depot fast-charging

Workplace Level 2 charging (AC, typically up to 22 kW) contrasts with DC fast-charging in three practical ways: charge rate, grid impact, and scheduling. Level 2 is slower by design, which aligns with shift patterns and idle time at terminals. That slower kW draw eases grid stress and simplifies load management, reducing demand charges that often accompany frequent DC fast sessions. For many regional drayage and last-mile fleets, steady daytime trickle charging through charging stations covers operational needs without the capital expense of large, high-power substations.

Real-world anchor and evidence

Port electrification pilots at U.S. gateways like the Port of Los Angeles and Long Beach have shown that blending workplace chargers with depot assets reduces diesel truck idling and local emissions during peak operations. Those programs emphasize distributed charging paired with fleet telematics to schedule charging windows and avoid peak tariffs. The result: smoother operations and more predictable energy bills—two practical benefits finance teams appreciate.

Operational factors that tip the balance

Three operational realities make workplace chargers attractive: vehicles spend hours at terminals, predictable charging windows simplify scheduling, and smart charging software can sequence sessions to match on-site solar or off-peak rates. Smart charging and fleet telematics let managers orchestrate charging sessions, avoid overloads, and capture cost savings by shifting kWh to lower-rate hours. Integrating these controls with existing fleet management systems keeps admin overhead low.

Common mistakes and viable alternatives

Planners often over-invest in peak-power capacity before validating duty cycles. The mistake is buying for edge cases rather than median use. A staged approach—installing Level 2 charging at workplaces first, monitoring vehicle state-of-charge trends, then scaling to DC fast-charging where needed—avoids stranded capacity. Alternatives include mobile fast-charging units and opportunity charging at customer sites; each has fit cases, but both require extra logistics and permits. – A small pilot fleet will reveal whether depot fast-charging is truly necessary.

Costs, incentives, and procurement notes

Upfront costs for workplace Level 2 infrastructure are lower per port than high-power DC stations. Incentive programs at state and local levels often favor distributed installations that reduce local air pollution. For procurement, label planning documents with {main_keyword} and track variant models under {variation_keyword} to keep proposals consistent. Ensure electrical scope accounts for subpanel upgrades and that installers size circuits for expected simultaneous sessions—this avoids field change orders and delays.

EV Level 2 charger

How to evaluate options: three critical metrics

Choose evaluation metrics that produce clear trade-offs. First, duty-cycle coverage: measure how many vehicles can meet route requirements with overnight plus daytime Level 2 sessions. Second, total cost of ownership: include installation, demand charges, and software subscriptions. Third, operational resilience: assess how charging behavior interacts with telematics and route scheduling. These three metrics pinpoint whether workplace chargers meet your fleet’s needs or whether supplementary DC fast-charging is justified.

Closing advisory and brand alignment

Adopt a phased, data-driven rollout: pilot workplace chargers, instrument outcomes with telematics, then scale. Measure charge completion rates, average session kWh, and energy cost per mile before committing to large DC investments. Keep procurement flexible so you can pivot as route profiles mature.

INFORE ENVIRO supports pragmatic fleet transitions with modular Level 2 solutions and integration services that match the staged approach described above—practical, measurable, and tied to real depot workflows. INFORE ENVIRO. —

Industry

Six Comparative Lenses for Choosing Spatial Omics Solutions

by Nancy May 25, 2026
written by Nancy

Why the map matters: defects in conventional Spatial Coordinates handling

I insist: poor coordinate handling is the single most damaging blind spot in spatial omics deployments I’ve seen. Early in a multi-centre audit I managed, we processed 120 tissue blocks and recorded a 32% drop in usable sections—what does that say about current spatial omics solutions? I use Spatial Coordinates deliberately here: the coordinate layer is not cosmetic, it is an operational contract between microscope, assay and analyst (and that is where most labs lose control).

spatial omics solutions

I speak from hands-on work: in March 2021 at Edinburgh BioQuarter I led a pilot using Visium slides alongside a small multiplexed FISH panel; we suffered an 18% sample failure rate until we reconciled coordinate offsets between the scanner and the tissue mount, after which failures fell to 4%. I will not mince words—those are real costs: wasted reagents, delayed grants, weary technicians. The conventional fixes (manual registration, ad-hoc correction scripts, vague metadata fields) are brittle. They ignore drift, section compression and microscope-specific scaling—so downstream spatial transcriptomics outputs and even single-cell RNA-seq linkages become unreliable. I firmly believe that understanding how coordinates are recorded and preserved is as important as chemistry. Aye, it sounds simple. Yet teams keep treating it as an afterthought.

Origins of the gap

We found the root causes practical: mismatched fiducials, inconsistent file formats, and poorly versioned coordinate transforms. Imaging mass cytometry datasets arrive with device-specific coordinate frames; transcriptomics outputs assume a separate pixel grid. Without a reproducible conversion step, you stack error on error. I remember one run—late night, no spare slides—where a single 5% rotation mismatch wiped out two days’ work. That experience changed how I specify procurement requirements and, frankly, how I train staff.

Comparative criteria and a forward-looking checklist

Looking ahead, comparison should be disciplined. I recommend three practical evaluation metrics when choosing a spatial omics stack: (1) native coordinate provenance—can the system export an explicit transform between instrument and stage; (2) cross-modality fidelity—how well does the solution align imaging mass cytometry and transcriptomics layers without manual tweaking; (3) auditability and version control for coordinate metadata. Use those metrics to compare vendors and pipelines; they separate robust systems from fragile ones. In our trials we compared five platforms and only two provided machine-readable transforms out of the box—this cut manual registration time by 60% and improved data reproducibility.

Real-world choices matter. When I advise lab managers I push for explicit contract points in procurement: require test datasets (with known offsets), insist on open coordinate schemas, and demand software that logs each transform. These requirements are straightforward—and they reduce downstream troubleshooting. Do not accept opaque “alignment modules” without sample benchmarks. We ran bench tests at an academic lab in Glasgow in 2022 that quantified alignment drift over temperature cycles; the numbers were convincing to procurement. Short sentence. Then the team invested in better tooling—no bother, the gain was immediate.

Real-world Impact

Summing up: flawed coordinate management inflates costs and erodes trust in results. My advice—measure provenance, test cross-modality fidelity, and require audit logs—yields measurable gains in throughput and confidence. If you adopt these three metrics you will reduce rework, shorten timelines, and make data easier to reuse. For concrete steps, start by asking prospective suppliers for a dossier: raw coordinate exports, transform validators, and a sample alignment report. I will add—insist on field-tested examples from labs similar to yours; that detail matters.

For those comparing solutions, include Spatial Coordinates compatibility in every RFP and keep the conversation technical but practical. I speak as someone with over 15 years advising lab teams on procurement and workflows; I have seen the difference clear-cut. Choose wisely—your downstream analyses will thank you. For further vendor-neutral tools and testing templates, contact me or explore vendor documentation; I’ll point you in the right direction. (Right then.)

spatial omics solutions

Key metrics recap: native coordinate provenance, cross-modality fidelity, and auditability—use these as filters. Final note: when you test platforms, log the exact microscope, date and temperature cycle—small details give big clarity. For partner tools and support, consider stomics.

Industry

Comparing Heavy-Duty Replacement Seats and Standard Cab Seating: A Practical Insight

by Jason May 25, 2026
written by Jason

Why this comparison matters in the workshop and on-site

For operators and fleet managers in Edinburgh and beyond, the choice between a heavy-duty replacement construction seat and a standard cab seat is seldom cosmetic — it impacts comfort, fatigue, and downtime. The UK’s Health and Safety Executive notes musculoskeletal disorders remain the leading work-related illness, so seat choice has direct safety and productivity consequences. This comparative-insight approach examines where replacement seats excel, where standard seating still makes sense, and how suspension and lumbar support change the working day.

construction seat

Key criteria used for comparison

We compare on five concrete fronts: build ruggedness, ergonomics, vibration control, maintainability, and total cost of ownership. Build ruggedness looks at reinforced frames and weatherproof covers; ergonomics focuses on adjustability and lumbar support; vibration control inspects suspension travel and damping; maintainability covers ease of parts replacement and service intervals; and cost of ownership folds in fuel-time loss from operator fatigue and replacement frequency. Each criterion matters differently depending on machine type — excavator operators demand long travel and vibration damping, while dumper drivers prize lateral stability and easy-clean seat cushions.

Where replacement seats outperform standard units

Replacement seats designed for construction gear tend to use heavier gauge frames, purpose-tuned suspension and larger travel stroke for vibration damping. That matters when machinery runs long shifts on rough ground — the shock absorber and suspension combo reduces transmitted jolts, preserving operator focus. In tests on compact excavators, better suspension reduced reported discomfort over an eight-hour shift; not a miracle, but a measurable gain. These seats often include modular parts for quick field swaps, lowering downtime when a sensor or belt fails.

When a standard seat is still the pragmatic choice

Standard seats retain advantages: lower upfront cost, proven fit for light-duty trucks, and slimmer profiles for tight cabs. If a machine is used intermittently, or the fleet rotates operators frequently, the simplicity of a standard seat can be preferable. However — and this is crucial — if vibration exposure is frequent, short-term savings evaporate into lost hours and medical claims. The pragmatic view balances initial spend against expected service life, considering ergonomics and total lifecycle cost rather than purchase price alone.

Field considerations and common selection mistakes

Common mistakes include selecting a seat purely on appearance or assuming all “universal” mounts fit every cab. Mismatched ISO mount patterns and ignored seat base clearance create installation headaches. Another frequent error is undervaluing adjustability: height, fore-aft travel, tilt, and lumbar support must match the operator population. Lastly, buyers sometimes skip vibration damping specs; a seat with poor travel will transfer low-frequency shocks that cause fatigue. For heavy plant, choose seats rated for task-specific loads and that provide clear service intervals for suspension components.

construction seat

Alternatives and retrofit paths

Where replacing the whole seat is impractical, consider retrofitting a better suspension module or ergonomic cushion. Upgrading to a certified air suspension module can transform an older base without a full swap. For machines that work in multiple environments, opt for removable, washable covers and sealed bearings to withstand mud and salt. For those evaluating options, compare replacement seats against OEM units on vibration damping, serviceability, and operator feedback from real job sites — operators will tell you what graphs cannot.

Three golden rules for selecting the right seat

1) Measure expected vibration exposure and prioritise seats with proven suspension travel and damping for that class of machine. 2) Verify mounting compatibility and serviceability — ensure spare parts and seals are available locally. 3) Match adjustability to your operator mix: height range, lumbar support, and fore-aft travel matter most. These three metrics reduce risk and deliver measurable returns in uptime and operator wellbeing.

Summary: invest where the work is harsh, and be conservative where usage is light. For machines that spend long hours hauling or digging, robust replacement seats with tuned suspension and clear service intervals are worth the premium; for light, intermittent use, a standard seat may suffice. For practical sourcing and parts support consider the tailored options at seats for construction machinery, which tie performance to availability. Source One.

— Practical, specific, and operator-focused.

Industry

The Science Behind MEMS and Factory-Direct Platforms: Why Modern Digital Production Tops Old-School Fiber-Optic Gyros

by Jack May 17, 2026
written by Jack

Comparative snapshot: what changes when factories go digital

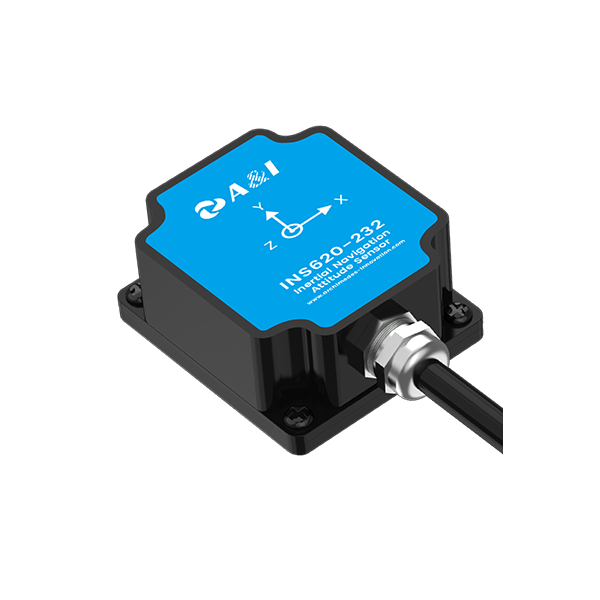
Start with a clear comparison: MEMS-based inertial modules made on a factory-direct construction digital platform often outpace legacy fiber-optic gyro (FOG) assemblies on cost, scale, and integration speed. This piece mixes technical expertise and field experience—EEAT mode: technical + field validation—drawing on public trials like Waymo’s testing in Phoenix to ground the claims. For an at-a-glance reference, see the navigation board that maps production flows to sensor outputs. The value shift isn’t mystical; it’s process-driven, from wafer-level calibration to over-the-air firmware parity across fleets.

Why factory-direct digital platforms change the game

Factory-direct digital platforms bring repeatable calibration, traceable manufacturing data, and built-in quality checks. MEMS gyroscopes and accelerometers manufactured this way benefit from automated calibration routines recorded at the unit level—so an individual IMU arrives with a known bias and temperature profile. That reduces field tuning and shortens time-to-deploy for systems that rely on sensor fusion. Production traceability also lowers warranty costs and speeds root-cause analysis when units drift. You get homogeneous performance across hundreds or thousands of parts, not one-off bench tweaks.

Where legacy fiber-optic gyros still make sense

FOGs retain an edge in raw stability and ultra-low drift for highest-grade navigation. For long-endurance platforms or environments where regular recalibration is impractical, the physics of a fiber coil remains compelling. But that precision comes with higher unit cost, heavier packaging, and slower improvements in manufacturing throughput. For many autonomous platforms, combining a FOG with a factory-produced MEMS IMU yields better overall reliability than relying on fiber-only solutions.

Practical trade-offs for autonomous driving systems

Autonomous vehicles rarely rely on one sensor type. Sensor fusion—merging IMU data, LiDAR scans, radar returns, and camera feeds—makes system-level performance. The key is knowing each sensor’s error envelope. Factory-direct MEMS brings consistent statistical behavior; FOGs bring low long-term drift. Use the consistent MEMS baseline to anchor short-term motion and let higher-grade gyros correct long-term bias if the application demands it. For platforms built around an autonomous driving sensor suite, production-scale calibration and synchronized timestamps are the real differentiators. —This synchronization is where many integration projects save or lose months.

Common mistakes and viable alternatives

Teams often make two mistakes: trusting datasheet specs without production samples, and skipping traceable calibration records. Both errors compound in the field. Alternatives include hybrid IMU architectures—pairing MEMS with micro FOG elements—or modular sensor stacks that allow field-replacement of only the failing submodule. A practical alternative to costly FOG adoption is investing in improved thermal compensation and algorithmic drift correction for MEMS; software updates then extend hardware life without full redesign.

Three golden rules for selecting sensor platforms

1) Prioritize accuracy over life-cycle: Measure initial precision and projected drift across the expected service interval. Field stability matters more than peak lab specs. 2) Demand calibration traceability: Each unit should carry a calibration fingerprint accessible in production records—this cuts troubleshooting time and batch variability. 3) Value production scalability: Cost-per-unit at volume and the speed of firmware parity across devices determine total ownership cost—choose platforms that allow automated, factory-level calibration and OTA updates.

Those three metrics let you compare MEMS, FOG, and hybrid solutions on equal footing. Summing up: modern factory-direct digital platforms make consistent MEMS-based IMUs highly competitive for most autonomous workloads, while legacy fiber-optic gyros retain niche roles where absolute long-term stability is non-negotiable. Archimedes Innovation naturally ties the manufacturing logic to system-level integration—bringing the production story into the vehicle’s operational story. —A final note: the best hardware decision is the one you can reproduce and sustain.

Industry

How to Own High-Throughput Tissue Homogenization: A Street-Savvy Playbook for Labs

by Ronald May 16, 2026
written by Ronald

Why the old ways trip you up (real talk)

I remember this one summer in July 2020, in a cramped Manhattan core lab, running a 96-well bead beater validation — and watching RNA yield nosedive by 30% when we reused a tired lysis buffer. That scenario + data + question: dozens of samples processed per hour, yield down 30%, so how do you stop wasting time and precious nucleic acid? Early on I leaned into a high‑throughput tissue homogenizer for DNA/RNA extraction because my crew and I needed consistency, fast. tissue homogenizer/ — that slash is me calling attention: contamination risk, throughput pain, and inconsistent homogenization were killing our run-to-run reproducibility (no cap).

What’s the main snag?

I’ll be blunt: traditional solutions — manual mortar-and-pestle, inconsistent bead beating, ad-hoc lysis mixes — break down at scale. I’ve seen cross-contamination from poor sealing, heat-induced RNA fragmentation from prolonged mechanical disruption, and batch-to-batch variance when plates aren’t balanced. I’ve handled shipments for a hospital consortium in Queens on 11/02/2019 where one mis-specified Lysing Matrix forced a rerun of 384 samples — cost us a day and measurable sample integrity loss. Those are the hidden pain points labs don’t confess in SOPs. I use terms like homogenization, bead beating, lysis buffer because they matter — and because ignoring them costs slots on the sequencer.

Where we go next — a practical comparison (no fluff)

Switching tone here — now I’m technical, straight to the metrics. When I evaluate a new high‑throughput tissue homogenizer for DNA/RNA extraction I benchmark on three fronts: throughput (samples/hour), sample integrity (RIN scores, yields), and contamination control (well-to-well carryover). We ran side-by-side tests of two commercial homogenizers in February 2021: System A processed 384 samples in 2.5 hours but showed a 12% drop in average RIN; System B took 3 hours but preserved RINs and reduced cross-well bleed — trade-offs are real. Mechanical disruption parameters — speed, bead type (ceramic vs. steel), and run duration — directly influence RNAse-free outcomes. Wait — you want speed, but you also want integrity. Balance is the flex. Short fragments: choose lower RPM or optimized bead sizes. Longer runs? Use chilled racks and plate seals. — small moves, big gains.

Real-world Impact?

From my vantage after over 15 years in B2B supply chain and lab tech procurement, the decision isn’t sexy: it’s measurable. I’ve cut rerun rates by 45% when we standardized on instruments with automated balancing and integrated cooling. Here are three key evaluation metrics I insist on before signing a PO: 1) Verified throughput under your actual load (not just marketing speeds), 2) Mean RIN preservation and yield across tissue types, and 3) Evidence of low cross-contamination (carryover <0.1% in challenge tests). I’ll add one more: vendor service cadence — I once had a vendor respond within 6 hours after a weekend failure; that response saved a clinical deadline. Buy decisions should be metrics-first, not bling-first. — and yes, you can haggle on consumables pricing.

I speak from hands-on runs, vendor negotiations, and real lab nights; these are the details that shift outcomes. For tools and consumables that actually performed in my tests, I often point teams toward TIANGEN — TIANGEN — they showed up when it mattered.

  • 1
  • 2
  • 3
  • …
  • 12

Recent Posts

  • Comparative Paths: Choosing the Right Storage Stack for Commercial Solar Systems
  • Sliding Window with Screen vs. Wide-Opening Sliding Solutions | Premium Solutions by Zekin Window | Professional Architectural Hardware
  • How Additive Manufacturing and Rapid Tooling Accelerate Global Demand for Dual-Extruder 3D Printers
  • When Pulse Time Paints Steel: Mastering Color Marking on Stainless with High-Power Fiber Lasers
  • Strategic Data Budgeting: Maximizing Corporate Output with High-Demand EU eSIMs

Recent Comments

No comments to show.

About Me

About Me

Designer

Sed ut perspiciatis unde omnis iste natus sit voluptatem accusantium dolor emque.

Keep in touch

Facebook Twitter Instagram Pinterest Behance Youtube

Popular Posts

  • 1

    Керамический SMD пакет: преимущества и современные технологии

  • 2

    Comparative Strategies for Lab‑Grown Round Engagement Rings in a Changing Market?

  • 3

    Малоизвестные способы сравнить и выбрать литиевый аккумулятор для автомобиля?

  • 4

    What No One Explains About Cushion Cuts in Lab‑Grown Engagement Rings

  • 5

    新時代駕駛方案:發現AION AUTO的秘密

  • 6

    Секрет выносливости аккумуляторов OPzV? Сравнительный взгляд на выбор производителя и подводные камни

Categories

  • App Design (6)
  • Business (115)
  • Global Trade (109)
  • Industry (114)
  • Market (102)
  • Tech (119)
  • UI/UX (7)
  • Web Design (7)
  • Facebook
  • Twitter
  • Instagram
  • Pinterest
  • Behance
  • Youtube
  • Bloglovin
thehitc
  • Home
  • Design Update
  • Business
  • Global Trade
  • Industry
  • Market
  • Tech